Display Types

Dashboard

Dashboard

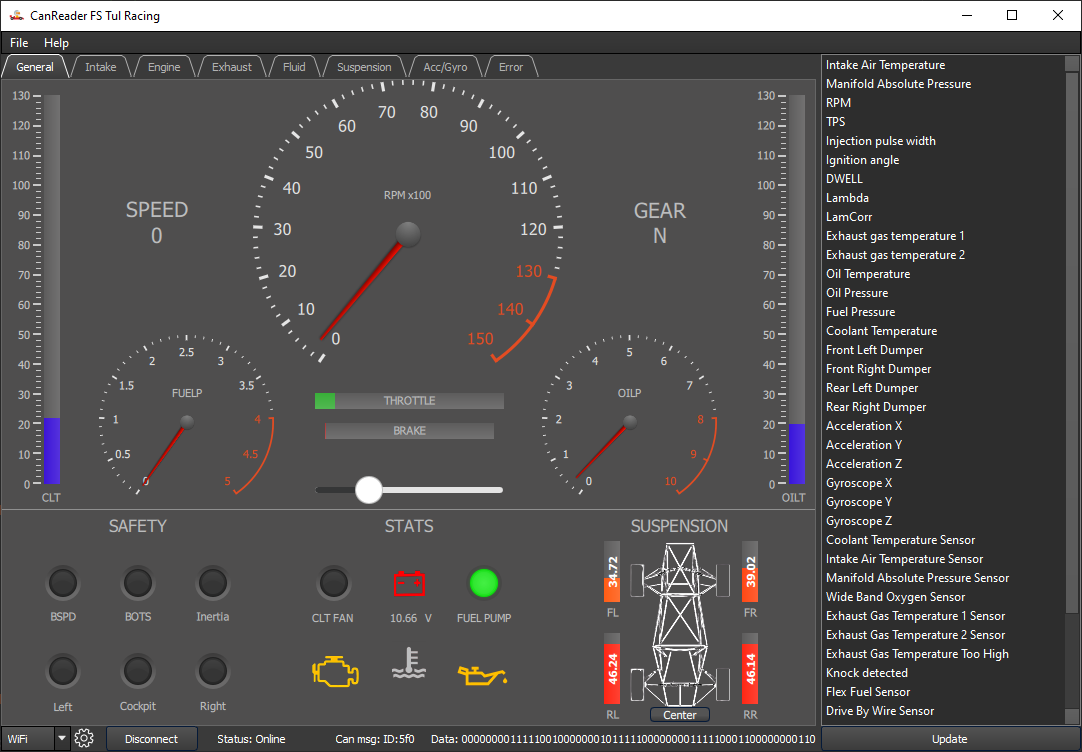
The designed dashboard consists of the following 4 parts:
  1. Overview
    The main and also the most spacious part displays basic information about the formula.
    On the sides are bar graphs showing the water temperature (left) and the oil temperature (right).
    Next there are 2 circular gauges showing fuel pressure (left) and oil pressure (right).
    The last and also the largest circular gauge shows the current RPM.
    There are also 2 horizontal bar graphs indicating throttle and brake rates.
    Lastly, there are two text indicators “SPEED” and “GEAR”.
  2. Safety
    The next section displays the status of individual components from the safety circuit.
    The safety circuit is defined by the rules of Formula Student.
    There are two stop buttons situated on the sides of the formula and one is in the cockpit.
    BOTS is a switch located behind the brake pedal, which interrupts the circuit in the event of heavy braking.
    BSPD is a device which opens the safety circuit in case that the brake pressure and the throttle is above a certain level.
    Inertia switch opens the safety circuit in the event of an impact.
    In case of safety circuit interruption due to the failure of any element, the power supply to the injectors, the ignition and the fuel pump is interrupted.
    The element, that caused the interruption of the circuit, lights up red.
  3. Stats
    The middle section informs the user about important states of formula.
    The left indicator lights up green when the water cooling fan is running.
    The right indicator lights up green when the fuel pump is running.
    The battery icon lights up red when the battery voltage drops below 11 V. Under the icon is the label showing the current battery voltage.
    The lower left icon indicates the engine status.
    It lights up yellow whenever the fuel pressure drops below 1 bar.
    It lights up red whenever one of the following occur. Fuel pressure will be greater than 4 bars, knock is detected or a fault occurs with the fuel pressure sensor or WBO sensor.
    The lower middle icon indicates the status of cooling circuit.
    It lights up yellow whenever the coolant temperature is higher than 115 °C.
    It lights up red whenever the coolant temperature is higher than 125 °C or if the there is a fault with the coolant temperature sensor.
    The lower right icon indicates the status of oil circuit.
    It lights up yellow whenever the oil pressure drops below 1 bar.
    It lights up red whenever the oil pressure exceeds 8 bar or if the there is a fault with the oil pressure sensor.
  4. Suspension
    The right section gives the user information about suspension.
    The compression of individual suspensions are graphically represented by bar indicators.
    There is also the text in the center of each bar indicating the current compression value.
    The user can programmatically center the compression values using the “Center” button.
    It allows to display relative compressions.

Note

Customizing the appearance of the dashboard is possible only with the QT Creator editor.
It is possible to change the connection of individual CAN variables to dashboard elements in the configuration file.

Graph tab

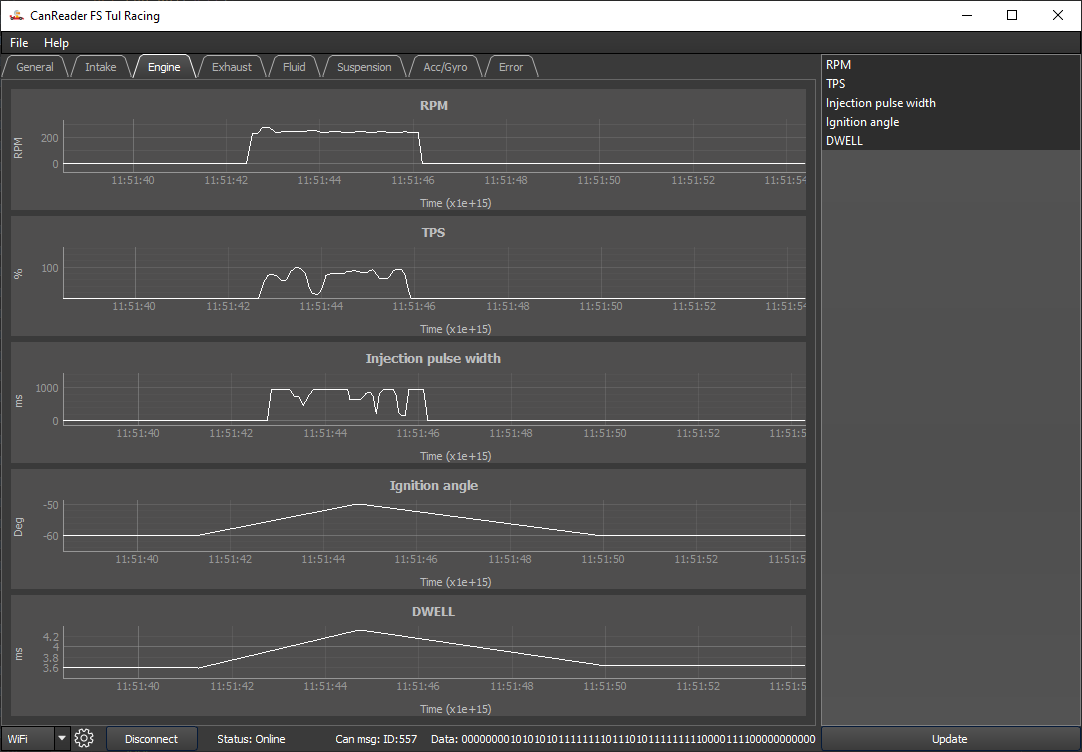
The second way of displaying data is to display individual variables in charts.
Each tab forms a group of charts that are logically related.
For example, the “Engine” tab displays engine-related data, such as RPM, valve opening, fuel injection time, etc.
Graph tab

Each graph can be controlled separately.
The left mouse button is used to move arbitrarily in the graph.
The mouse wheel controls zooming in or out.
The right mouse button opens option menu.
In the menu user can set axes range, grid display, drawing method, etc.
There is also the option to export data in .csv format.
Alternatively, the user can save the whole graph, or just a part of it, as an image in a standard format such as .png, .jpg or vector .svg.
In the case user want to go back to the latest data, he can do so by pressing the “c” or the “f” key.

Note

At this version the user cannot add, move or remove individual charts directly in the application.
In case he would like to set what, where and in what order will be displayed, then he can edit the configuration file that contains all this information.

Error tab

The last type of display is a panel showing errors of individual formula components.
All indicators in this panel are connected to the binary variables.
Error tab

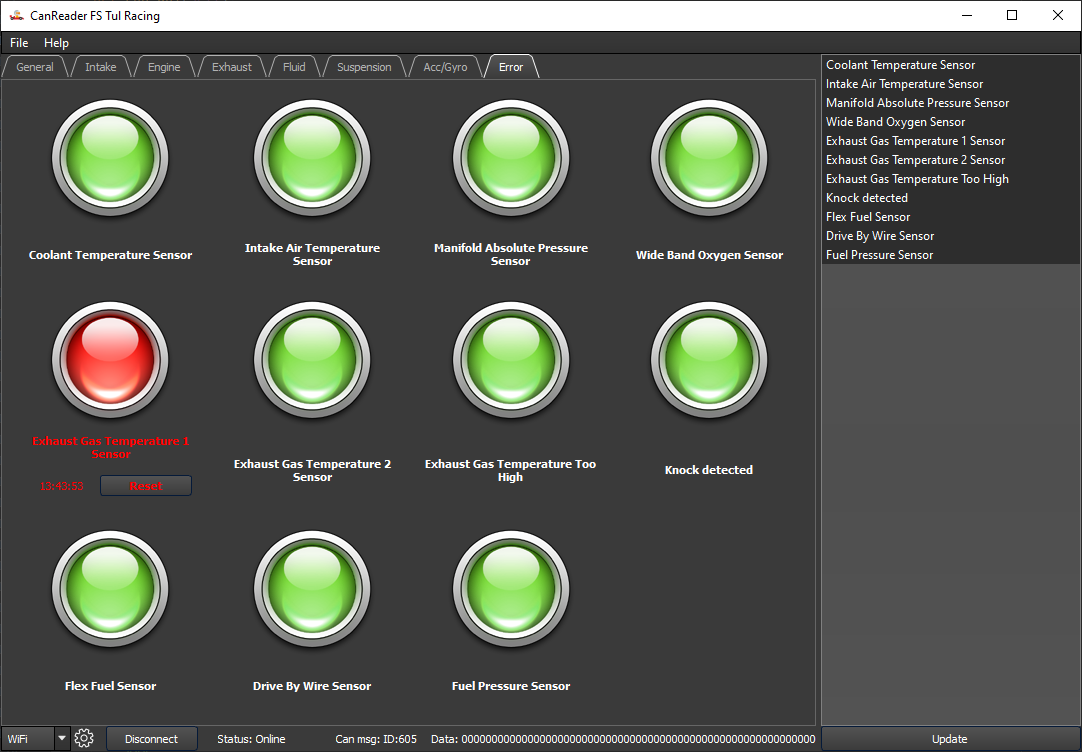
The indicator can take one of the following three states:
  1. OK - This state is indicated by a green indicator and means that everything is OK.

  2. Error - This state is indicated by a red indicator and indicates an occurrence of error. In addition to changing the indicator, the time when the error occurred and the restart button are displayed. The error does not disappear until the user manually restarts it. This ensures that the user is aware of the error, even if he is not currently on the error bar.

  3. No data - This state is indicated by a yellow indicator and means that the current state has not been received since startup, or last restart.